In the modern risk landscape, volatility is the only constant. Geopolitical shocks, cyber threats, regulatory shifts, and operational failures can materialize with little warning, exposing enterprises to billions in potential losses. For Chief Risk Officers and board members, the challenge is no longer merely identifying risks—it is monitoring them in real-time and understanding when they are approaching critical thresholds.
Key Risk Indicators (KRIs) have emerged as the essential language of risk communication between operational management and the board. They translate complex risk exposures into measurable, comparable metrics that enable proactive intervention. When a KRI flashes amber, it signals that risk is approaching the organization’s defined tolerance. When it flashes red, it demands immediate escalation.
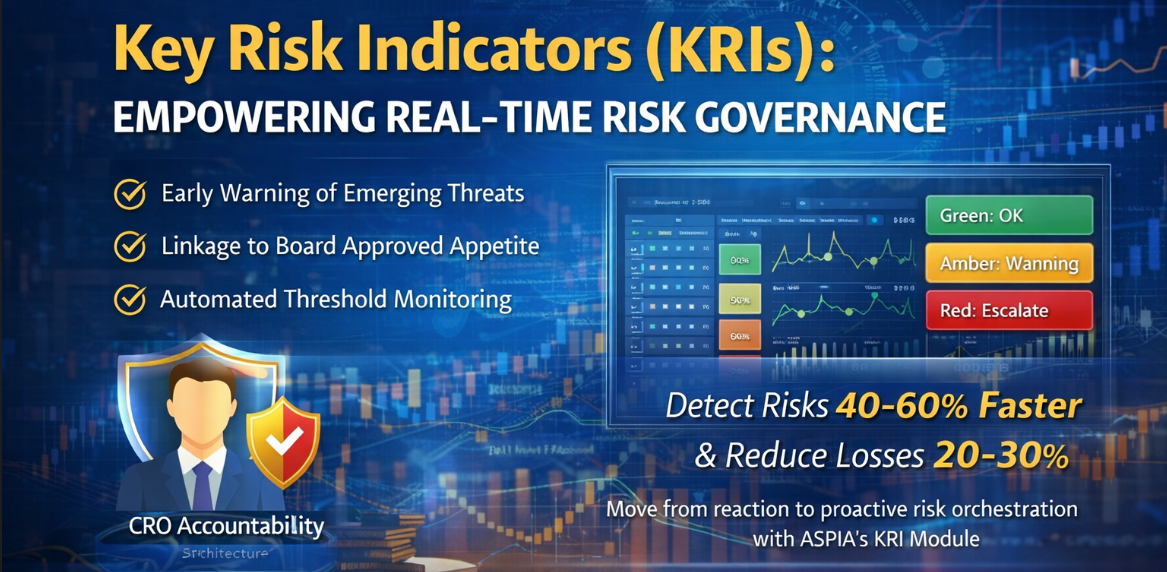
The financial stakes are significant. According to industry analyses, organizations with mature KRI programs detect emerging risks 40-60% faster and reduce the average cost of risk events by 20-30%. Conversely, the absence of robust KRIs has been a recurring theme in supervisory enforcement actions, with regulators citing “inadequate risk monitoring” as a contributing factor in failures ranging from the 2008 financial crisis to more recent banking collapses.
This guide provides a definitive framework for designing, implementing, and governing KRIs that meet the expectations of boards, regulators, and enterprise stakeholders. It covers the distinction between leading and lagging indicators, practical examples across major risk categories, the ASPIA KRI Governance Maturity Index, and the governance architecture required to translate data into defensible decisions.
2. What Are Key Risk Indicators?
Key Risk Indicators (KRIs) are quantifiable metrics used by organizations to measure the potential exposure to a specific risk and to provide an early warning signal that a risk may be approaching or exceeding an acceptable threshold. They are the navigational instruments of the enterprise risk management function, offering a forward-looking view of the risk landscape.
KRIs serve three primary strategic functions:
- Early Warning: They alert management to increasing risk exposures before a loss event occurs, enabling proactive mitigation.
- Risk Appetite Monitoring: They provide a quantitative mechanism to track actual risk-taking against the board-approved risk appetite and tolerance limits.
- Performance Feedback: They help assess the effectiveness of controls and risk mitigation strategies over time.
Unlike generic metrics, effective KRIs are directly linked to specific strategic objectives and risk tolerances. A KRI for credit risk, for example, might track “percentage of loans to borrowers with credit scores below 650” against a board-approved limit of 15%. When that percentage approaches the limit, it triggers a pre-defined action, such as a review of underwriting standards.
In modern banking, KRIs are no longer a reporting function—they are an architectural discipline. They form the foundation of the governance infrastructure that enables boards to discharge fiduciary duties with demonstrable oversight over enterprise exposure.
3. KRI vs KPI vs KCI: A Strategic Comparison
One of the most common sources of confusion in risk governance is the distinction between Key Risk Indicators, Key Performance Indicators, and Key Control Indicators. While related, they serve fundamentally different purposes. The table below clarifies the differences.
| Metric Type | Focus | Purpose | Time Orientation | Audience |
|---|---|---|---|---|
| Key Risk Indicator (KRI) | Measures level of risk exposure | Early warning of potential risk events; monitors against risk appetite | Leading (predictive) or Lagging (historical) | Risk Committees, CRO, Board |
| Key Performance Indicator (KPI) | Measures performance of business processes | Tracks efficiency, effectiveness, achievement of strategic objectives | Usually Lagging (past performance) | Business Unit Heads, CEO, Operations |
| Key Control Indicator (KCI) | Measures effectiveness of controls | Monitors whether controls are functioning as intended to mitigate risk | Real-time / Operational | Control Owners, Internal Audit, Second Line |
Example in Practice:
- KPI (Performance): “Number of new loans originated this quarter” — tracks business growth.
- KRI (Risk): “Percentage of new loans to borrowers with debt-to-income ratio > 43%” — tracks credit risk exposure.
- KCI (Control): “Percentage of loan files with completed income verification before disbursement” — tracks control effectiveness.
The relationship is hierarchical. Weak KCI performance (controls not working) will eventually lead to elevated KRI readings (increased risk exposure), which may ultimately impact KPI performance (e.g., increased loan defaults reducing profitability). A mature risk governance framework monitors all three in an integrated manner.
4. Why KRIs Are Critical in Modern Risk Governance
The elevation of KRIs from operational metrics to board-level governance tools is driven by several converging factors.
- Regulatory Expectation: Supervisors globally, including the Basel Committee, the RBI, and the SEC, now expect institutions to have robust risk appetite frameworks with clear, measurable limits. KRIs are the mechanism for demonstrating adherence to these limits.
- Speed of Risk Evolution: Risks today emerge faster than ever. A cybersecurity vulnerability can be exploited within hours. A geopolitical event can disrupt supply chains overnight. Monthly or quarterly reporting is no longer sufficient. KRIs enable continuous monitoring.
- Board Accountability: Directors are increasingly held personally liable for risk failures. KRIs provide them with the objective data needed to challenge management and fulfill their fiduciary duties.
- Data-Driven Decision Making: In an era of big data, intuition is no longer enough. KRIs provide the empirical foundation for strategic decisions about capital allocation, business strategy, and risk mitigation.
- Early Warning Capability: Leading KRIs, such as employee turnover in a critical function or negative news sentiment about a key supplier, provide precious time to intervene before a risk crystallizes into a loss.
5. How KRIs Connect to the Risk Appetite Framework (RAF)
A KRI without a defined threshold is just a data point. The power of KRIs is unlocked when they are explicitly linked to the organization’s Risk Appetite Framework (RAF).
The RAF defines the types and quantum of risk an organization is willing to accept in pursuit of its strategic objectives. It is articulated through:
- Risk Appetite Statements: Qualitative statements of willingness to accept risk (e.g., “We will not tolerate compliance breaches.”).
- Risk Tolerance Limits: Quantitative boundaries for specific risks (e.g., “Maximum acceptable credit loss rate: 1.5%”).
KRIs are the translation of these board-approved limits into measurable metrics.
The typical linkage works as follows:
- Board Approval: The board approves a risk tolerance limit (e.g., Maximum IT system downtime: 99.5% availability, equating to 43.8 hours per year).
- KRI Definition: A KRI is defined as “Monthly system availability percentage.”
- Threshold Setting:
- Green (Within Appetite): Availability ≥ 99.5%
- Amber (Approaching Tolerance): Availability between 99.0% and 99.4%
- Red (Exceeding Tolerance/Escalate): Availability < 99.0%
- Monitoring & Escalation: The KRI is monitored continuously. If availability drops to 99.2% (Amber), the IT director is alerted. If it drops to 98.9% (Red), it is automatically escalated to the CRO and Risk Committee with a pre-defined remediation plan.
This framework ensures that risk-taking remains within the boundaries set by the board and that breaches are visible and actionable at the appropriate level.
Link KRIs to Your Risk Appetite Framework
Ensure your KRIs are directly tied to board-approved tolerance limits. ASPIA’s KRI Module helps you define thresholds and escalation protocols with automated monitoring.
See ASPIA’s KRI Module6. Types of KRIs: Leading vs Lagging Indicators
Effective KRI programs incorporate both leading and lagging indicators. They serve different but complementary purposes.
Leading KRIs (Predictive)
Leading indicators are forward-looking metrics that signal potential future risk events. They provide an early warning, allowing management to intervene before a loss occurs. They are the most valuable for proactive risk management but often the most difficult to identify and validate.
Examples:
- Operational Risk: Employee turnover rate in key control functions; volume of unreconciled transactions.
- Cyber Risk: Number of unpatched critical vulnerabilities; percentage of employees who fail phishing simulations.
- Credit Risk: Slowdown in a specific industry sector; increase in loan covenant waiver requests.
Lagging KRIs (Historical)
Lagging indicators measure past events and actual losses. They confirm whether risks have materialized and provide data on the effectiveness of risk management over time. They are essential for trend analysis, regulatory reporting, and validating the accuracy of leading indicators.
Examples:
- Operational Risk: Number of internal fraud incidents; total value of operational losses.
- Credit Risk: Non-Performing Loan (NPL) ratio; loan loss provision expense.
- Cyber Risk: Number of data breaches; hours of system downtime due to cyber attack.
A balanced program uses both: Leading KRIs to steer away from the rocks, and lagging KRIs to confirm you successfully avoided them.
7. Examples of KRIs by Risk Category
The following table provides practical examples of KRIs across major risk categories, with suggested measurement units and typical thresholds. These should be adapted to your organization’s specific risk profile and risk appetite.
| Risk Category | Key Risk Indicator (KRI) | Type | Measurement | Typical Amber | Typical Red |
|---|---|---|---|---|---|
| Credit Risk | Non-Performing Loan (NPL) Ratio | Lagging | % of total loan portfolio | > 2.5% | > 4.0% |
| Loan covenant waiver requests | Leading | % of monitored loans | > 10% QoQ | > 20% QoQ | |
| Operational Risk | Internal fraud incidents | Lagging | Number per quarter | > 3 | > 5 |
| Employee turnover in control functions | Leading | % annualized | > 12% | > 18% | |
| Cyber Risk | Unpatched critical vulnerabilities | Leading | # > 30 days old | > 5 | > 10 |
| Phishing simulation failure rate | Leading | % of employees | > 8% | > 15% | |
| Supply Chain | Single-source dependency | Lagging | % of critical components | > 20% | > 30% |
| Liquidity Risk | Liquidity Coverage Ratio (LCR) | Lagging | % | < 115% | < 105% |
8. How to Design Effective KRIs: A Step-by-Step Framework
Designing effective KRIs requires a structured approach. The following seven-step framework ensures that KRIs are relevant, measurable, and actionable.
- Identify Critical Risks: Start with your organization’s risk universe and risk register. Focus on the risks that could most significantly impact strategic objectives.
- Link to Risk Appetite: For each critical risk, identify the board-approved risk appetite and tolerance limits. The KRI must be designed to monitor the organization’s position relative to these limits.
- Define the Metric: Determine what you will measure. It should be relevant, quantifiable, reliable, and sensitive.
- Set Thresholds (Traffic Light System): Define clear thresholds for green, amber, and red based on historical data and regulatory requirements.
- Assign Ownership: Every KRI must have a clear owner in the first line responsible for monitoring and acting on breaches.
- Define Data Source and Frequency: Identify the source system and monitoring frequency (daily, weekly, monthly).
- Establish Response Protocols: Pre-define actions to be taken when thresholds are breached.
9. Building an Enterprise KRI Framework
An effective enterprise KRI framework is not simply a collection of metrics. It is a structured system that aligns risk monitoring with strategy, risk appetite, and operations. A mature KRI framework includes:
- A centralized risk register with clearly defined risk owners and accountability.
- KRIs mapped to strategic objectives and the board-approved risk appetite statement.
- Clear data governance defining source systems, calculation methodologies, and validation protocols.
- An escalation matrix specifying who is notified at each threshold level and the required response time.
- Integration with performance management to ensure risk insights inform business decisions.
Building this framework requires cross-functional collaboration between the first line (risk owners), second line (risk oversight), and third line (internal audit). The ASPIA KRI Framework provides a pre-configured taxonomy and workflow engine to accelerate this process.
10. Common Mistakes Organizations Make with KRIs
- Too Many KRIs: Flooding dashboards with hundreds of metrics obscures what is truly important. Focus on the critical few.
- Lack of Linkage to Risk Appetite: KRIs that are not tied to board-approved limits become meaningless data points.
- Purely Lagging Indicators: Relying only on historical loss data means you are always looking backward.
- Static Thresholds: Risk environments change. Thresholds must be periodically reviewed and adjusted.
- Poor Data Quality: “Garbage in, garbage out.” If the underlying data is unreliable, the KRI is useless.
- No Accountability: KRIs without assigned owners and response protocols are decorative.
- Manual Tracking: Relying on spreadsheets for KRI tracking leads to version control issues, missed escalations, and audit trail gaps.
11. KRI Governance Model (Three Lines of Defense Alignment)
A robust KRI program is embedded within the organization’s governance structure. The three lines of defense model provides a clear framework for roles and responsibilities.
- First Line: Operational Management (Risk Owners): Owns day-to-day monitoring, takes corrective action, ensures data accuracy.
- Second Line: Risk & Compliance Oversight: Defines KRI framework, validates design, monitors aggregated dashboard, escalates breaches.
- Third Line: Internal Audit: Provides independent assurance over KRI processes and data reliability.
- Risk Committee & Board: Reviews aggregated dashboards, oversees red breaches, ensures remedial action.
KRI automation alone does not guarantee sound risk governance; it must be supported by leadership accountability and independent oversight.
12. Technology & Automation: Moving from Manual Tracking to Continuous Monitoring
The limitations of spreadsheets for KRI management are well-documented. They lack audit trails, suffer from version control issues, and cannot provide real-time alerts. As the volume and velocity of data increase, manual tracking becomes unsustainable.
Modern Enterprise Risk Management Software provides a centralized platform for KRI management, offering:
- Automated Data Feeds: Integration with source systems eliminates manual data entry and errors.
- Real-Time Dashboards: Aggregated views with traffic-light color coding and drill-down capabilities.
- Automated Alerts & Escalations: System automatically notifies owners and escalates if no action is taken.
- Audit Trails: Complete, immutable record of all KRI data changes and actions.
- Trend Analysis: Historical data enables pattern identification and validation of leading indicators.
The shift from periodic manual tracking to automated continuous monitoring is the defining characteristic of advanced KRI programs.
Automated KRI Monitoring and Risk Appetite Tracking
Leading organizations are moving beyond basic data aggregation to true automated KRI monitoring and risk appetite tracking. This involves:
- Real-time data ingestion from core banking systems, HR platforms, and external risk feeds.
- Dynamic threshold calculation that adjusts for changing risk environments and business cycles.
- Automated workflow triggers that assign remediation tasks when KRIs breach amber or red levels.
- Integration with risk appetite dashboards that show board members a real-time view of compliance with approved limits.
ASPIA’s automated KRI monitoring capabilities provide exactly this level of sophistication, enabling risk teams to move from reactive reporting to proactive risk orchestration.
13. Designing an Effective KRI Dashboard for Board Reporting
Board dashboards must be strategic, not operational. They should provide a concise, aggregated view of the enterprise’s risk profile without overwhelming directors with detail.
Effective KRI reporting to board members includes:
- Aggregated View: Summary page showing status of top-tier KRIs across major risk categories using a traffic-light system.
- Drill-Down Capability: For any amber or red KRI, ability to see the metric, trend, tolerance limit, explanation, and action plan.
- Concentration Metrics: Visual representations of key concentrations that could amplify risk.
- Emerging Risk Spotlight: Section highlighting one or two emerging risks warranting board attention.
- Trend Analysis: Charts showing how key KRIs have evolved over the past 12 months.
ASPIA’s pre-configured board dashboards are designed specifically for this purpose, translating complex risk data into clear, actionable insights.
14. The ASPIA KRI Governance Maturity Index
To assess where your organization stands and where it needs to go, we have developed the ASPIA KRI Governance Maturity Index, a five-level model for KRI capability. Based on market observations, over 50% of enterprises remain at Level 2 maturity—relying on manual, spreadsheet-based tracking with limited linkage to risk appetite.
| Level | Name | Characteristics | Data & Technology | Linkage to Risk Appetite |
|---|---|---|---|---|
| Level 1 | Initial / Ad-Hoc | KRIs defined sporadically, often in response to a loss. No formal process. | Spreadsheets, manual data pulls | None or very weak |
| Level 2 | Repeatable but Manual | KRIs defined for major risks. Tracked periodically via spreadsheets. Version control issues common. | Manual data entry; static reports | Some KRIs linked to limits, but monitoring is periodic |
| Level 3 | Defined & Centralized | Centralized KRI register. Automated data feeds for some metrics. Basic dashboards. | Hybrid (some automation, some manual) | Clear linkage to risk appetite for key risks |
| Level 4 | Managed & Predictive | Real-time monitoring for most KRIs. Automated alerts and escalations. Leading indicators used. | Fully automated data feeds; ERM platform | All material risks have KRIs linked to appetite; thresholds dynamically reviewed |
| Level 5 | Optimized & Integrated | KRIs fully integrated with ERM, capital planning, and strategy. Predictive analytics used. | AI-driven analytics; real-time dashboards | KRIs directly inform capital allocation and strategic decisions |
Where Does Your Organization Stand?
Benchmark your KRI program against the ASPIA KRI Governance Maturity Index. Identify gaps and build a roadmap to Level 5.
Book a Strategy Call15. Regulatory Expectations (Basel, RBI, SEC)
Regulators globally have embedded expectations for robust KRI frameworks into their supervisory guidance.
- Basel Committee on Banking Supervision: BCBS 239 requires risk data aggregation and timely reporting. Pillar 2 expects banks to use KRIs in ICAAP.
- Reserve Bank of India (RBI): Master Direction on Risk Management mandates a robust risk appetite framework monitored through KRIs.
- SEC (U.S. Securities and Exchange Commission): Climate disclosure rules implicitly require monitoring KRIs related to climate risk.
The trend is clear: Regulators expect KRIs to be embedded into the fabric of governance, with clear links to risk appetite, reliable data, and demonstrable oversight.
16. Frequently Asked Questions (FAQs)
What are Key Risk Indicators (KRIs)?
What is the difference between KRI and KPI?
What are leading vs lagging indicators in risk management?
How many KRIs should an organization have?
How do KRIs link to the Risk Appetite Framework?
What is a KRI dashboard?
How can technology improve KRI monitoring?
17. Conclusion: From Reporting to Risk Orchestration
Key Risk Indicators are far more than compliance metrics. When designed and governed effectively, they become the central nervous system of the enterprise—providing real-time intelligence on the organization’s health, enabling proactive intervention, and empowering boards to fulfill their oversight responsibilities with confidence.
The journey from manual, spreadsheet-based tracking to an integrated, continuous monitoring framework requires investment in technology, process, and culture. But the payoff is substantial: faster detection of emerging threats, reduced cost of risk events, and a defensible governance architecture that meets the highest regulatory expectations.
The strategic question for risk leaders is no longer whether to implement KRIs, but how to mature their KRI capabilities to the point where they enable true risk orchestration—where data drives decisions, and risk intelligence becomes a competitive advantage.
Elevate Your KRI Governance with ASPIA
ASPIA’s KRI Module enables:
- ✓ Centralized KRI framework management
- ✓ Automated threshold monitoring and escalation
- ✓ Real-time board dashboards with drill-down
- ✓ Risk appetite linkage and compliance tracking
- ✓ Immutable audit trails for regulatory defensibility
Move from periodic reporting to continuous risk orchestration.
Request an ASPIA Demo