For regulated financial institutions, the ability to delineate between performance, risk, and control is not just a matter of management hygiene—it is a regulatory necessity. Understanding the difference between Key Risk Indicators (KRIs), Key Performance Indicators (KPIs), and Key Control Indicators (KCIs) is essential for building a defensible enterprise risk management framework. While KPIs measure outcomes and strategic success, KRIs act as early warning systems for potential threats that could derail those outcomes. KCIs, often the most overlooked, verify whether the fences (controls) built to mitigate those risks are functioning as intended. For audit committees and Chief Risk Officers (CROs), conflating these indicators can lead to a false sense of security—where strong performance masks weakening controls, or where risk events occur despite “green” risk ratings.
This article provides a strategic comparison of these three metric classes, grounding them in the regulatory expectations of frameworks like Basel III and BCBS 239. It offers practical guidance on implementation, governance, and common pitfalls to ensure your institution’s metric framework is defensible, dynamic, and decision-useful.
What Are KPIs, KRIs, and KCIs? Defining the Triad
To govern effectively, leadership must first understand the distinct “smell” of each indicator. They are not interchangeable; they are interdependent.
Key Performance Indicators (KPIs): The Outcome Measures
KPIs are financial and non-financial metrics used to define and evaluate the success of an organization or of a particular activity in which it engages. They are backward-looking and focused on execution.
- Focus: Efficiency, strategic goals, revenue growth, customer acquisition.
- The Board Question: “Are we achieving our strategic objectives?”
- Example: Return on Equity (ROE), Net Interest Margin (NIM), Loan application processing time.
Key Risk Indicators (KRIs): The Early Warning System
KRIs are metrics used to provide an early signal of increasing risk exposure in various areas of the enterprise. They are predictive or current-state indicators of potential future losses. These early warning indicators allow management to act before a threshold breach occurs.
- Focus: Volatility, probability of default, concentration, external threats.
- The Board Question: “What could stop us from achieving our objectives, and is that likelihood increasing?”
- Example: Loan-to-Value (LTV) ratios for a new portfolio, employee turnover in compliance, number of cyber intrusion attempts.
Key Control Indicators (KCIs): The Assurance Mechanism
KCIs measure the health and effectiveness of the internal controls designed to mitigate risks. They answer the question: “Are our defenses working?” . This is the essence of control effectiveness testing.
- Focus: Control gaps, testing results, remediation timelines, policy adherence.
- The Board Question: “How do we know the controls are working?”
- Example: Percentage of high-risk exceptions approved by compliance, time to patch critical vulnerabilities, number of failed automated reconciliations.
Why the Distinction Matters for Regulated Entities
In the wake of high-profile banking failures, regulators—including the RBI, the PRA, and global bodies under Basel guidelines—have scrutinized not just whether risks were identified, but whether institutions confused activity with protection.
Regulatory Context (RBI, Basel III, BCBS 239)
- Basel III / BCBS 239 (Risk Data Aggregation): These frameworks demand that risk reports (KRIs) be accurate and integrated with performance data (KPIs). They implicitly require that the data underpinning controls (KCIs) be auditable. According to the Basel Committee’s Basel III: finalising post-crisis reforms, the quality of risk data directly impacts capital adequacy.
- RBI’s Guidance on Risk Management: The Reserve Bank of India increasingly expects banks to demonstrate a clear link between their risk appetite framework and the metrics monitored by the Board. A KRI breach should trigger a specific, pre-defined remedial action, validated by KCIs.
- Supervisory Review (Pillar 2): Regulators expect banks to have internal processes for assessing capital adequacy. An over-reliance on KPIs (e.g., “profits are up, so risk is down”) without corresponding KRIs and KCIs is a classic red flag during supervisory reviews.
The Core Principle: KPIs tell you you’re running fast. KRIs tell you a cliff is approaching. KCIs tell you whether the brakes are working.
When Should a Bank Use a KPI vs a KRI vs a KCI?
A common question from business line managers and risk committee members alike is understanding the practical application of each metric type. The decision hinges on what you are trying to observe or influence.
- Use a KPI when you need to measure the output of a business process or strategy. If the goal is to track revenue growth from a new digital channel, a KPI is your tool. It answers “How much did we achieve?”
- Use a KRI when you need to monitor the potential for future losses or volatility. If you are concerned about the credit quality of a rapidly growing loan portfolio, a KRI (like the average Debt-to-Income ratio of new borrowers) provides the leading insight. It answers “What might go wrong?”
- Use a KCI when you need to verify that a specific control is working. If you have a policy requiring dual authorization for large wire transfers, a KCI (like the percentage of transfers flagged for missing authorizations) tells you if the rule is being followed. It answers “Are our safeguards holding?”
In a well-governed bank, these three are used in concert. A deteriorating KRI (e.g., rising fraud attempts) should prompt a review of the relevant KCI (e.g., fraud detection rule coverage). A strong KPI (e.g., high transaction volume) without a corresponding KRI and KCI is a sign of potential blind spots.
How They Fit into the Risk Governance Framework
Integrating these metrics requires moving beyond siloed reporting. The most effective governance frameworks view these indicators as a layered narrative, fully integrated with modern enterprise risk management software to automate data aggregation and reporting. For insights on technology enablers, see our guide on Enterprise Risk Management Software for Banks.
The Interplay: A Descriptive Model
Imagine a commercial bank’s lending division:
- KPI (Performance): “Origination volume increased by 15% this quarter.”
- KRI (Risk): “Risk Appetite breach: Concentration in Commercial Real Estate (CRE) has risen from 18% to 25% of the portfolio.”
- KCI (Control): “Credit underwriting checklist adherence has dropped to 92% (below the 98% tolerance), and three loans were funded without required second signatures.”
In this scenario, the strong KPI hides a brewing storm. The KRI signals the storm (concentration), and the KCI explains why it happened (control failure in underwriting). The Audit Committee should focus on the KCI to fix the root cause, while the Board Risk Committee focuses on the KRI to manage the exposure. As outlined in our broader Key Risk Indicators (KRI) Framework & Dashboard Guide, threshold calibration is critical to ensuring these signals are neither false alarms nor silent failures.
Governance Framework Architecture
To visualize a robust governance structure, consider a three-tiered pyramid aligned with the three lines of defense model:
- Tier 1: Board / Committee Level (Strategic Oversight): High-level, aggregated KRIs and KPIs. Focus on adherence to the risk appetite framework and strategic plan. Dashboards use RAG (Red/Amber/Green) statuses in the board reporting dashboard.
- Tier 2: Management / Risk Committee Level (Tactical Oversight): Detailed KRIs and KCIs by business line (e.g., Retail, Treasury, Operations). Focus on root cause analysis and remedial action tracking.
- Tier 3: Business Unit / Control Owners (Operational Management): Granular KCIs and operational metrics. Focus on control effectiveness testing results, incident reporting, and daily compliance.
Practical Implementation in Regulated Banking
Implementing this triad requires discipline. Here is a step-by-step approach to embedding them in a banking environment, ensuring alignment with broader Risk Management in Banking principles.
Step 1: Map to the Risk Appetite Framework
Every KRI must tie back to a statement in the RAS. If your risk appetite framework states, “The bank will not tolerate operational losses exceeding 1% of gross income,” your KRIs should track near-misses and control failures that could lead to such losses.
Step 2: Define and Distinguish with Precision
Use a common data dictionary. For a specific risk (e.g., Cyber Security), define:
- KRI: Number of unpatched critical vulnerabilities older than 30 days.
- KCI: Percentage of systems scanned weekly; successful completion of patch deployment.
Step 3: Set Thresholds and Escalation Triggers
Indicators are useless without context. Establish protocols for when a threshold breach occurs:
- Risk Tolerance (Green): Normal operating conditions.
- Risk Capacity (Amber): Warning zone requiring management attention.
- Risk Limit (Red): Breach of RAS requiring Board notification and immediate remediation.
Step 4: Automate Data Feeds
Manual collection of KCIs is prone to error. Leverage GRC (Governance, Risk, and Compliance) platforms or dedicated enterprise risk management software to automate the aggregation of control data (e.g., from access management systems or reconciliation tools) to ensure integrity, aligning with BCBS 239 principles.
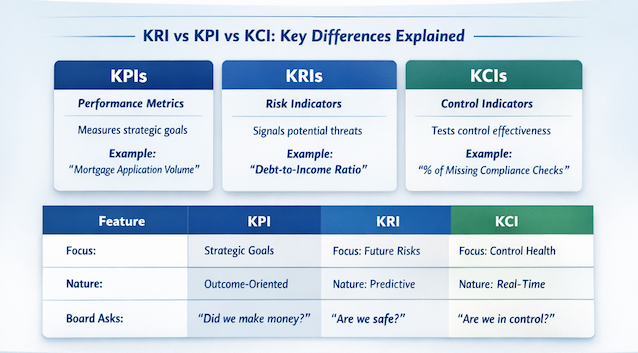
KRI vs KPI vs KCI: Key Differences Explained
Understanding the differences between these three metric types is fundamental to designing an effective bank risk reporting framework. While they are interconnected, each serves a distinct purpose in the governance ecosystem.
KPIs measure historical performance and strategic achievement. They answer “What did we accomplish?” and are typically owned by business line executives. KRIs measure potential future risk exposure. They answer “What could go wrong?” and are owned by the risk management function. KCIs measure control effectiveness. They answer “Are our controls working?” and are owned by control owners and internal audit.
The relationship between them is causal: Weak KCIs (control failures) lead to elevated KRIs (risk exposure), which if unaddressed, will eventually impact KPIs (financial performance). This cascade is why leading institutions monitor all three in an integrated board risk dashboard.
| Feature | Key Performance Indicator (KPI) | Key Risk Indicator (KRI) | Key Control Indicator (KCI) |
|---|---|---|---|
| Primary Focus | Achievement of strategic goals | Exposure to future uncertainty | Effectiveness of controls |
| Nature | Lagging / Outcome-oriented | Leading / Predictive | Real-time / Diagnostic |
| Board Question | “Did we make money?” | “Are we safe?” | “Are we in control?” |
| Banking Example | Mortgage application volume | Debt-to-Income ratio of new borrowers | % of loan files with missing income verification |
| Regulatory Link | Business Model Analysis | ICAAP / Stress Testing | Internal Audit / Compliance Testing |
| Action on Breach | Adjust strategy | Reduce exposure / Hedge | Fix the control process |
The Governance Triangle: KPI · KRI · KCI
KPI
Strategic Goal “Did we achieve?”
KRI
Risk Exposure “What could go wrong?”
KCI
Control Effectiveness “Are we in control?”
Weak KCIs lead to elevated KRIs, which eventually impact KPIs. Integrated monitoring across all three enables predictive governance.
Real-World Case Study: The Digital Lending Launch
Background: A mid-sized regional bank launched a new digital unsecured lending product to meet a KPI of “20% growth in retail loan book.”
The Metrics:
- KPI: Loan origination volume hit 110% of target in the first month. (Seen as a success).
- KRI: The bank tracked the “Average Credit Score” of new borrowers. It dropped from 720 to 680. The Risk Committee flagged this as a breach of the moderate risk appetite framework.
- KCI: A deep dive revealed the control issue: The automated underwriting model was approving loans based on cash flow but was failing to flag applicants with recent bankruptcies—a critical control failure in the “Adverse Check” process. This highlighted a lapse in control effectiveness testing.
Outcome: The Board did not kill the product (KPI was good). Instead, the CRO invoked a “control remediation” plan. The KCI was monitored weekly until the fix was implemented, and the KRI was watched to ensure credit scores stabilized. The integrated view prevented a portfolio of bad loans six months down the line.
Regulatory & Audit Committee Considerations
For the Audit Committee and Board Risk Committee, reviewing these metrics requires specific lines of inquiry, often facilitated by a robust board reporting dashboard:
- Line of Sight: Can we trace a specific KRI (e.g., increased fraud attempts) down to the KCI that measures the control effectiveness (e.g., fraud detection rules updated)?
- Data Integrity: Are the KCIs self-reported by business lines, or are they independently verified by Risk or Internal Audit? Self-reported controls are often green until the day they fail.
- Dynamic Recalibration: Are metrics static, or are they updated to reflect the current environment? Post-pandemic, for example, many banks had to adjust KRIs for commercial real estate and KCIs for remote work cybersecurity.
- Regulatory Reporting: Under BCBS 239, the Board must have confidence in the accuracy of the risk data (KRIs) used for decision-making. This places a premium on the governance of the data feeding the KCIs.
For further regulatory guidance, refer to the BCBS 239 Principles for Effective Risk Data Aggregation and Risk Reporting.
Common Pitfalls
Even sophisticated institutions stumble when implementing these frameworks. Here are the most common governance mistakes:
- Pitfall 1: The “Green Dashboard” Delusion. All indicators are green because the KPIs are good, but the KRIs and KCIs are not being updated or are set with thresholds that are too loose, failing to act as true early warning indicators.
- Pitfall 2: Confusing Activity with Impact. Reporting on the number of risk meetings held (a metric) rather than the trend of residual risk exposure (a true KRI).
- Pitfall 3: Static Indicators. Using the same KRIs for five years while the business model transforms (e.g., moving to cloud banking but still monitoring physical server uptime as the primary IT KRI).
- Pitfall 4: KCI Neglect. Focusing 80% of committee time on KPIs (financials) and KRIs (big risks), but ignoring the KCIs that validate whether the risk responses are actually working.
- Pitfall 5: Data Silos. The KRI data sits in the Risk system, the KPI data in the Finance system, and the KCI data in the Audit system. Without integration, the narrative is lost, undermining the three lines of defense.
Frequently Asked Questions (FAQs)
What is the main difference between a KRI and a KCI?
Can a single metric be both a KPI and a KRI?
How many KRIs should a bank report to the Board?
How do KCIs relate to Internal Audit?
RBI-Aligned TPRM Framework: Complete Guide for Indian BanksWhat role does technology play in managing these indicators?
How often should indicators be reviewed for relevance?
Conclusion: Building an Integrated Risk Intelligence Framework
For regulated banks, the distinction between KPI, KRI, and KCI is not merely semantic—it is the foundation of a resilient risk culture. KPIs drive the business forward, KRIs keep it from falling off a cliff, and KCIs ensure the guardrails are secure. By integrating these three lenses, risk leadership and audit committees can move from reactive oversight to predictive governance.
The goal is to create a unified narrative where the Board can see not just what is happening (performance), but what could happen (risk) and how well we are prepared (control). To build a robust framework that stands up to regulatory scrutiny and delivers genuine business value, start by solidifying your approach to risk indicators.
For a detailed blueprint on designing, implementing, and governing a best-in-class KRI program—including dashboard templates and threshold setting—explore our comprehensive guide: Key Risk Indicators (KRI) Framework & Dashboard Guide.
Integrate Your Risk Metrics with ASPIA
ASPIA’s enterprise risk management platform bridges the gap between KPIs, KRIs, and KCIs—providing integrated dashboards that link performance, risk, and control data in a single governance framework.
- ✓ Unified view of KPIs, KRIs, and KCIs across the enterprise
- ✓ Automated threshold monitoring and breach escalation
- ✓ Board-ready dashboards with drill-down to control evidence
- ✓ Regulatory reporting aligned with BCBS 239 and RBI requirements
Move from siloed metrics to integrated risk intelligence.
Request an ASPIA Demo