
Most organizations treat IT risk assessment as a compliance exercise—run a scan, list vulnerabilities, produce a report. That approach misses the point entirely. A mature IT risk assessment does something far more important: it connects technology risks to business impact and decision-making.
IT risk assessment is a structured, repeatable, and continuous process used to identify, analyze, and prioritize risks across IT assets, enabling organizations to make informed decisions on risk treatment and control implementation. In simple terms, it answers: “What can go wrong in our IT environment, how bad will it be, and what should we do about it?”
This guide provides a complete framework for understanding IT risk assessment—from process and scoring models to enterprise templates, checklists, real examples, and how GRC automation transforms manual assessments into continuous risk intelligence.
1. IT Risk Assessment: Quick Answer & Definition
IT risk assessment is a structured, repeatable, and continuous process used to identify, analyze, and prioritize risks across IT assets, enabling organizations to make informed decisions on risk treatment and control implementation.
IT risk assessment answers: “What can go wrong in our IT environment, how bad will it be, and what should we do about it?”
At a surface level, IT risk assessment identifies threats and vulnerabilities. At an enterprise level, it connects technology risks to business impact and decision-making. This transforms IT risk assessment into a core component of enterprise risk management and governance.
2. Why IT Risk Assessment is Critical (Beyond Security)
Most blogs stop at “prevent breaches.” That’s shallow. In reality, IT risk assessment is critical because it:
1. Drives Investment Decisions
Where should security budget go? Which risks justify control investment? IT risk assessment provides data-driven answers.
2. Supports Regulatory Compliance
ISO 27001 requires risk-based controls. SOC 2 requires risk-driven control design. RBI/DPDPA require risk visibility. IT risk assessment is the foundation.
3. Enables Audit Readiness
Auditors verify the risk → control → evidence linkage. Without a proper risk assessment, this chain breaks.
4. Reduces Business Disruption
Downtime, breaches, and failures are minimized when risks are identified and addressed proactively.
Without IT risk assessment, security becomes guesswork. Organizations invest in the wrong controls, miss critical risks, and remain exposed to preventable failures.
3. IT Risk Assessment Process: How It Actually Happens
This is where depth matters. The following steps represent how mature organizations conduct IT risk assessments.
Step 1: Scope Definition (Context Setting)
Not all systems are assessed equally. Organizations define business processes (e.g., payments, onboarding), systems in scope (apps, infrastructure, vendors), and regulatory scope (ISO, RBI, GDPR).
Mistake: Treating all assets equally → leads to wasted effort and missed critical risks.
Step 2: Asset Criticality Modeling
Assets are not just listed—they are scored. Typical classification:
- Critical → Revenue-impacting systems
- High → Sensitive data systems
- Medium → Internal tools
- Low → Non-critical systems
This determines the risk priority baseline.
Step 3: Threat Modeling (Not Just Listing)
Mature organizations map threats using STRIDE/attack vectors, threat intelligence feeds, and industry-specific threat patterns.
Example: Banking → Fraud, account takeover; SaaS → Data breach, privilege escalation.
This step defines the attack landscape.
Step 4: Vulnerability Identification (Control Gap View)
This is not just scanning. It includes technical gaps (misconfigurations), process gaps (no approvals, weak workflows), and control failures (ineffective monitoring).
Key insight: Risk = Threat × Vulnerability × Impact
Step 5: Risk Scoring (Quantification Layer)
This is where most blogs are weak. The formula is:
Risk Score = Likelihood × Impact
How Likelihood is Determined: Threat frequency, exposure level, control strength
How Impact is Determined: Financial loss, data sensitivity, regulatory penalty, operational disruption
Example: Likelihood = 4 (likely), Impact = 5 (critical system) → Risk Score = 20 (Critical)
Step 6: Risk Treatment (Action Layer)
Each risk gets a strategy:
- Mitigate → Apply controls
- Transfer → Insurance / vendor
- Accept → Document justification
- Avoid → Eliminate activity
This step links risk to actual execution.
Step 7: Continuous Monitoring (Lifecycle)
Risk assessment is not static. Organizations track mitigation status, reassess risks periodically, and detect new threats. This creates a continuous risk lifecycle.
This converts risk into decision-ready data.
4. Risk Matrix and Scoring Model: Quantifying Risk
A standardized risk matrix converts qualitative assessments into actionable priority levels.
Risk Matrix (5×5 Example)
| Likelihood \ Impact | 1 (Very Low) | 2 (Low) | 3 (Medium) | 4 (High) | 5 (Very High) |
|---|---|---|---|---|---|
| 5 (Almost Certain) | Medium (10) | High (15) | Critical (20) | Critical (25) | Critical (25) |
| 4 (Likely) | Low (4) | Medium (8) | High (12) | Critical (16) | Critical (20) |
| 3 (Moderate) | Low (3) | Low (6) | Medium (9) | High (12) | Critical (15) |
| 2 (Unlikely) | Low (2) | Low (4) | Low (6) | Medium (8) | High (10) |
| 1 (Rare) | Low (1) | Low (2) | Low (3) | Low (4) | Medium (5) |
Risk Matrix Interpretation
| Score Range | Level | Action Required |
| 1–5 | Low | Accept / monitor |
| 6–10 | Medium | Plan mitigation |
| 11–15 | High | Prioritize remediation |
| 16–25 | Critical | Immediate action required |
This converts risk into decision-ready data that leadership can act upon.
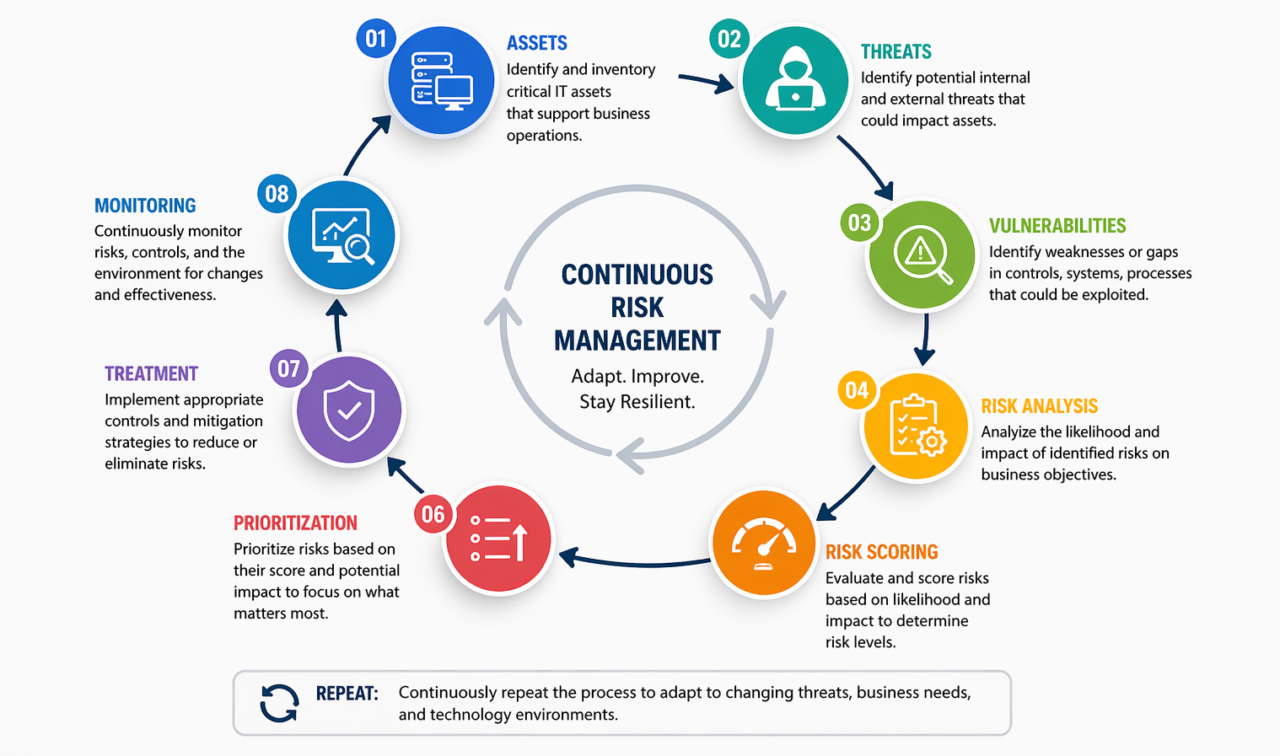
5. IT Risk Assessment Diagram: The Continuous Lifecycle

This represents a continuous, feedback-driven lifecycle.
Unlike traditional approaches that treat risk assessment as a periodic project, mature organizations embed this lifecycle into their governance processes—continuously identifying, assessing, and responding to IT risks.
6. IT Risk Assessment Template: Real Enterprise Structure
This is NOT a generic template—this is how mature GRC programs operate. The following structure ensures audit traceability, accountability, and compliance alignment.
Core Identification Layer
- Risk ID (unique identifier)
- Asset ID
- Asset Owner
- Business Function
Risk Definition Layer
- Risk Description
- Threat Source
- Vulnerability
- Root Cause
Quantification Layer
- Likelihood Score
- Impact Score
- Risk Score
- Risk Level
Control Layer
- Control ID
- Control Description
- Control Type (Preventive/Detective)
- Control Effectiveness
Compliance Mapping
- ISO 27001 Control ID
- NIST Control Mapping
- SOC 2 Mapping
Ownership & Accountability
- Risk Owner
- Control Owner
- Responsible Team
Treatment Layer
- Mitigation Plan
- Action Items
- Timeline
Evidence & Audit Layer
- Evidence links
- Audit comments
- Validation status
Residual Risk Layer
- Residual score
- Risk acceptance status
Monitoring Layer
- Review frequency
- Current status
- Closure date
This structure ensures audit traceability, accountability, and compliance alignment. In platforms like Aspia, this is fully automated and interconnected.
📥 Download IT Risk Assessment Template
Get a ready-to-use Excel template for IT risk assessment, including scoring formulas and risk matrix.
Download IT Risk Assessment Template (Excel)7. IT Risk Assessment Checklist: Execution-Level
This checklist ensures complete execution, not partial assessment.
- ☐ Asset classification completed
- ☐ Business impact defined
- ☐ Threat modeling performed
- ☐ Vulnerability assessment completed
- ☐ Risk scoring validated
- ☐ Controls mapped to frameworks
- ☐ Owners assigned
- ☐ Evidence documented
- ☐ Residual risk calculated
- ☐ Monitoring enabled
8. IT Risk Assessment Example: Cloud Banking Platform
The following example illustrates a complete IT risk assessment lifecycle for a cloud banking platform.
Scenario: Cloud Banking Platform
| Asset: | Customer data system (core banking database) |
| Threat: | Unauthorized access to customer data |
| Vulnerability: | Weak IAM (Identity and Access Management) controls |
| Likelihood: | 4 (Likely) |
| Impact: | 5 (Very High – regulatory fines, reputational damage, customer loss) |
| Risk Score: | 20 → Critical |
| Control Mapping: | MFA (Preventive), RBAC (Preventive), Logging (Detective) |
| Control Effectiveness: | MFA: Effective, RBAC: Partially Effective, Logging: Effective |
| Residual Risk: | Reduced to Medium (Score: 8) after control implementation |
| Action Plan: | Implement role-based access review quarterly. Enhance IAM monitoring. |
| Owner: | CISO / IT Security Manager |
| Status: | In Progress – MFA implemented, RBAC review scheduled |
This shows full lifecycle + control effectiveness—from identification through mitigation to residual risk calculation.
9. How IT Risk Assessment Supports Leadership Decisions
This is where real value comes. Leadership uses IT risk assessment to:
- Decide where to invest security budget – Data-driven allocation, not guesswork
- Prioritize remediation efforts – Focus on critical and high risks first
- Accept vs mitigate risks – Informed risk acceptance with documented justification
- Align IT risk with business strategy – Ensure technology risks are understood at the board level
This turns IT risk assessment into a strategic decision tool, not just a technical exercise.
10. How IT Risk Assessment Works in GRC Platforms
Modern GRC systems enable organizations to move beyond spreadsheets and manual processes:
- Centralized risk visibility – Single source of truth for all IT risks
- Automated scoring – Risk scores calculated dynamically based on likelihood and impact
- Control mapping – Link risks directly to controls and compliance frameworks
- Audit-ready reports – One-click reports for regulators and auditors
- Real-time dashboards – Risk heat maps and trends at a glance
- Workflow automation – Assignment, escalation, and approval tracking
Aspia enables real-time dashboards, risk-control-compliance linkage, and scalable risk management—transforming IT risk assessment from a periodic project into continuous risk intelligence.
11. Why Manual IT Risk Assessment Fails
Many organizations rely on spreadsheets and manual processes, leading to significant failures:
- Excel dependency – Version control issues, broken formulas, manual errors
- No traceability – Cannot track changes or historical risk ratings
- Delayed updates – Risk assessments become outdated before completion
- Weak accountability – No automated assignment or escalation
- No control linkage – Risks and controls managed in isolation
- Poor audit readiness – Scrambling to produce evidence for auditors
This leads to incomplete risk coverage and exposes organizations to preventable failures.
12. IT Risk Assessment Maturity Model
Assess your organization’s IT risk assessment capability using this five-level maturity model.
| Level | Name | Characteristics | Risk Coverage |
|---|---|---|---|
| Level 1 | Ad-Hoc | No formal process. Risks assessed only after incidents. No documentation. | Very low – reactive only |
| Level 2 | Basic | Annual assessments. Spreadsheet-based. Basic scoring. Limited asset criticality. | Low – significant blind spots |
| Level 3 | Structured | Standardized methodology. Asset classification. Threat modeling. Control mapping. | Moderate – known risks captured |
| Level 4 | Managed | Automated workflows. Real-time dashboards. Continuous monitoring. Integration with controls. | High – comprehensive coverage |
| Level 5 | Optimized | Integrated GRC platform. Predictive analytics. AI-driven threat detection. Continuous risk intelligence. | Optimal – continuous and predictive |

