
In real systems, RTO and RPO are design constraints, not documentation. They directly control infrastructure topology, data consistency models, automation depth, and cost envelope. Every architecture decision is essentially a trade-off between RTO, RPO, and cost.
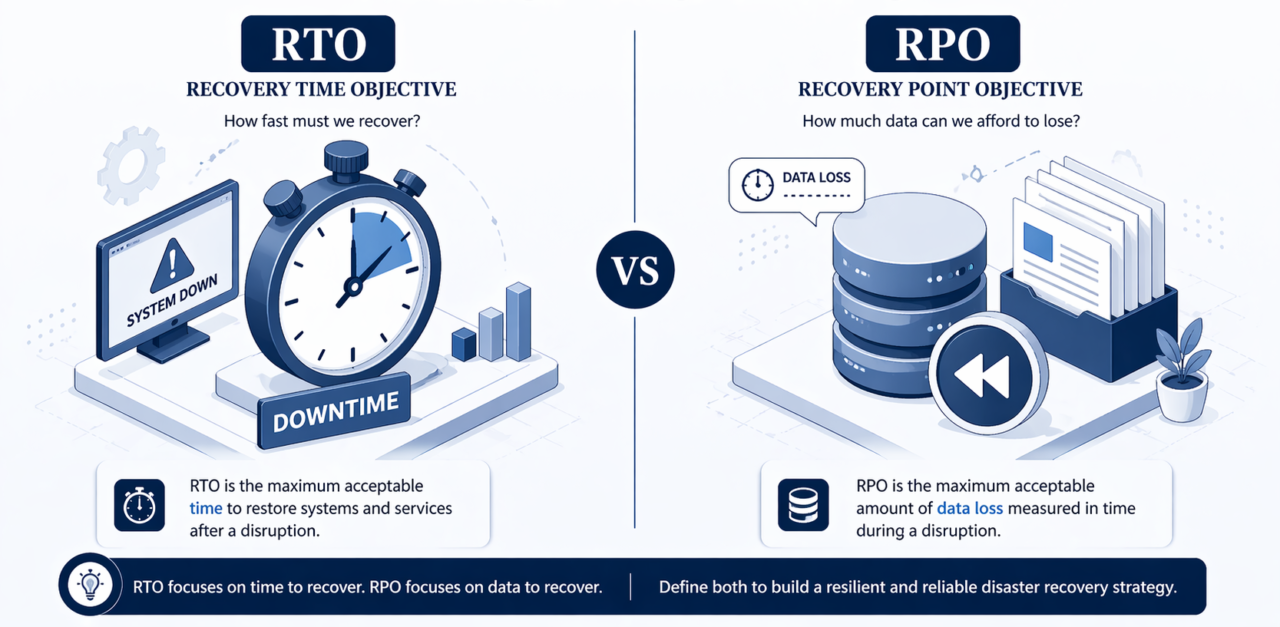
RTO (Recovery Time Objective) is the maximum acceptable downtime after a disruption. RPO (Recovery Point Objective) is the maximum acceptable data loss measured in time. In simple terms: RTO = downtime tolerance; RPO = data loss tolerance.
This guide provides a complete framework for understanding RTO and RPO—from precise definitions and real production examples to DR architectures, AWS patterns, audit requirements, and a free Excel calculator for practical implementation.
1. What is RTO and RPO? Precise Definition
RTO (Recovery Time Objective): Maximum acceptable downtime after a disruption
RPO (Recovery Point Objective): Maximum acceptable data loss measured in time
RTO = Downtime Tolerance | RPO = Data Loss Tolerance
2. Why RTO/RPO Are Not Just Metrics: Execution Reality
In real systems, RTO and RPO are design constraints, not documentation. They directly control:
- Infrastructure topology – multi-AZ vs multi-region
- Data consistency model – sync vs async replication
- Automation depth – manual vs auto failover
- Cost envelope – infrastructure spending
Every architecture decision is essentially a trade-off between RTO, RPO, and cost.
3. RTO Deep Dive: What Actually Happens During Failure
RTO is often misunderstood as a single SLA number. In reality, it is a pipeline of recovery operations:
RTO = Detection + Decision + Failover + Restore + Validate
1. Detection (MTTD)
Health checks, synthetic monitoring, alerting pipelines (CloudWatch, Prometheus). Hidden risk: Alert fatigue → delayed detection.
2. Decision Layer
Manual approval vs automated failover, incident commander involvement. Key insight: Manual decision = biggest RTO killer.
3. Failover Execution
DNS switch (TTL impact), load balancer rerouting, traffic draining. Failure mode: DNS caching delays.
4. Restore & Compute Recovery
Boot DR instances, attach volumes, start services. Critical factor: cold vs warm infrastructure.
5. Validation (RTA Gate)
Smoke tests, data integrity checks, business transaction validation. RTA (Actual Recovery Time) is measured here.
Real Measured Example
| Stage | Time |
|---|---|
| Detection | 2 min |
| Decision | 3 min |
| Failover | 8 min |
| Restore | 12 min |
| Validation | 5 min |
| RTA | 30 min |
RTA must be ≤ RTO for compliance.
4. RPO Deep Dive: Data Consistency Reality
RPO is not about backups—it is about write-path behavior.
RPO Depends On:
- Replication Type – Sync → near-zero RPO; Async → seconds to minutes
- Backup Strategy – Snapshot-based (interval driven); Log-based (granular recovery)
Practical Formula
RPO ≈ max(replication lag, backup interval, commit delay)
Real Example
- Async replication lag: 10 sec
- Snapshot interval: 10 min
- Failover to replica → RPO = 10 sec
- Restore from backup → RPO = 10 min
Hidden Risks (Most Teams Miss This)
- Data corruption replicated instantly
- Large uncommitted transactions
- Eventual consistency issues
Low RPO ≠ correct data
5. RTO vs RPO: Non-Obvious Differences
| Dimension | RTO | RPO |
|---|---|---|
| Domain | Compute / orchestration | Data / storage |
| Failure signal | Downtime | Data inconsistency |
| Optimization | Automation | Replication |
| Hidden risk | Dependency chains | Corruption propagation |
Critical Insight: You can meet RTO but still fail business recovery due to bad RPO.
6. DR Architecture Mapping: Engineering Decision Layer
| Architecture | RTO | RPO | Reality |
|---|---|---|---|
| Backup & Restore | High | High | Cheapest, slowest |
| Pilot Light | Medium | Medium | DB ready, compute cold |
| Warm Standby | Low | Low | Scaled-down infra |
| Hot Standby | Very Low | Very Low | Fully ready DR |
| Active-Active | Near-zero | Near-zero | Complex + expensive |
AWS Mapping (Practical)
- Multi-AZ RDS → sync → RPO ≈ 0
- Cross-region replica → async → RPO seconds
- Route 53 failover → reduces RTO
- Auto Scaling + AMIs → reduces cold start
Cost vs Risk Trade-Off (Decision Framework)
| Target | Cost | Complexity | Risk |
|---|---|---|---|
| High RTO/RPO | Low | Low | High |
| Medium | Medium | Medium | Medium |
| Near-zero | Very High | High | Low |
Optimization Rule: Invest where business impact per hour is highest.
7. How to Define RTO/RPO: GRC + Engineering Combined
| Tier | RTO | RPO |
|---|---|---|
| Tier 0 | 5–15 min | <1 min |
| Tier 1 | 30–60 min | 5–15 min |
| Tier 2 | 4–24 hr | 1–12 hr |
No testing = no compliance
8. Real Failure Scenarios: Production Lessons
- Manual failover adds 20–30 min
- Replica exists but failover not tested
- Backup works but restore fails
- Third-party dependency blocks recovery
- Corrupted data replicated to DR
These are actual audit findings, not theory.
9. Audit & Compliance Expectations
Auditors expect:
- Defined RTO/RPO per system
- DR drill reports (RTA evidence)
- Backup + replication logs
- Mapping to ISO 27001 (A.5.30 / A.8), SOC 2 (Availability), RBI / banking DR guidelines
Without evidence → control failure
10. Free RTO/RPO Calculator (Excel) – CISO-Level Model
To move from theory to execution, use our advanced RTO/RPO calculator designed for real-world disaster recovery planning.
📥 Download RTO/RPO Calculator
Download RTO/RPO Calculator (Excel)This is not a basic template—it is a decision model used by CISOs, architects, and risk teams.
- Calculate Actual Recovery Time (RTA vs RTO): Breaks recovery into detection, failover, validation time
- Determine Real Data Loss Exposure (RPO): RPO = max(replication lag, backup interval)
- Quantify Business Impact of Downtime: Revenue impact per hour, system criticality
- Identify High-Risk Systems: Combine business criticality, impact, and recovery gaps
- Validate DR Strategy Against Reality: Compare target vs actual, identify gaps
- Support Audit & Compliance: Documented RTO/RPO per system, measurable recovery logic
- Bridge Business, Risk, and Engineering: Connects business impact (₹), risk exposure, and technical recovery capability
11. RTO/RPO Maturity Model
| Level | Name | Characteristics | Recovery Assurance |
|---|---|---|---|
| Level 1 | Undefined | No RTO/RPO defined. No DR plan. Recovery based on luck. | None |
| Level 2 | Documented | RTO/RPO defined on paper. No testing. No validation. | Low – unverified |
| Level 3 | Tested | Annual DR drills. RTA measured. Gaps documented. | Moderate – periodic validation |
| Level 4 | Automated | Automated failover. Real-time monitoring. Continuous validation. | High – proactive recovery |
| Level 5 | Resilient | Active-Active. Near-zero RTO/RPO. Self-healing systems. Integrated GRC. | Optimal – continuous resilience |
Ready to turn RTO/RPO into audit-ready execution?
Map RTO/RPO → assets → business processes. Track RTA vs RTO automatically. Store DR drill evidence for audits.
Request an ASPIA Demo12. How Aspia Helps: RTO/RPO to Audit-Ready Execution
Defining RTO/RPO is easy. Proving them during audits is where most teams fail. With ASPIA GRC, you can:
- Map RTO/RPO → assets → business processes
- Track RTA vs RTO automatically
- Store DR drill evidence for audits
- Link risks → controls → BCP/DR plans
Stop managing DR in spreadsheets. Start managing it like a regulated organization.
13. Final Insight
RTO and RPO are not technical settings—they are business risk decisions enforced through architecture. Organizations that align BIA → architecture, automate failover, and continuously validate achieve real resilience + audit readiness.
14. Frequently Asked Questions (FAQs)
What is the full form of RTO?
It defines how long your business can tolerate downtime before significant impact occurs.
What is the full form of RPO?
It defines how much data your organization can afford to lose during a failure.
How are RTO and RPO achieved in AWS or cloud environments?
RTO and RPO are achieved using:
- Synchronous or asynchronous replication
- Multi-AZ and multi-region deployments
- Automated failover mechanisms
- Backup and snapshot strategies
Lower RTO and RPO require higher levels of automation and infrastructure investment.
What is the difference between RTO, RPO, MTTR, MTBF, and RCO?
| Metric | Focus | What It Measures |
|---|---|---|
| RTO | Recovery target | Maximum acceptable downtime |
| RPO | Data loss | Maximum acceptable data loss |
| MTTR | Performance | Actual recovery time |
| MTBF | Reliability | Time between failures |
| RCO | Data integrity | Consistency and correctness after recovery |
Transform DR Compliance with ASPIA
ASPIA provides a unified GRC platform that turns RTO/RPO from documentation into audit-ready evidence. Our solution enables organizations to:
- ✓ Map RTO/RPO to assets and business processes
- ✓ Track RTA vs RTO automatically
- ✓ Store DR drill evidence for audits
- ✓ Link risks → controls → BCP/DR plans
- ✓ Generate audit-ready DR compliance reports

